Magento Logging with ELK Stack
If you are maintaining several Magento instances or use features like AWS autoscaling, you have many different places to look for your Magento application logs. In these cases a central logging application is very helpful.
In this post we will examine how to use the ELK stack with Magento logs.
What is ELK Stack?
ELK is the abbreviation for Elasticsearch, Logstash and Kibana, which all three are tools that work together as a central logging application.
Besides ELK of course there are also other logging and monitoring applications especially in the Software-as-a-Service space like Splunk, Logz.io, Datadog, etc.
But in my opinion these tools either lack the problem of data privacy as they are hosted in US or are very expensive for smaller clients.
That’s why it is a good idea to buy a cheap VPS server with lots of CPU and memory and host the ELK stack yourself. With growing data and requirements it might be necessary later to switch to a more advanced monitoring setup consisting e.g. of an ELK cluster with multiple Elasticsearch instances. Of course an alternative is also the hosted ELK Stack of Elastic itself.
How to forward Magento 1 logs to ELK Stack?
After you have successfully setup the ELK Stack - which is out of scope of this blog post - the next step is to push the Magento 1 application logs to the Logstash software, which is responsible for receiving, processing and forwarding the logs to the Elasticsearch search instance(s) then.
For pushing the log files to Logstash we will use the Elastic Filebeat software client that will run on the Magento instances as a service daemon. Of course therefore a more advanced hosting setup is required where you are able to login via SSH and run the Filebeat daemon in the background with e.g.:
nohup ./filebeat -e -c filebeat.yml &The final setup for our monitoring solution will then look like this:
Filebeat (on the Magento instance) -> Logstash -> Elasticsearch
Configuring Filebeat
After you have installed Filebeat on the Magento server, we will use the following part in the filebeat.yml configuration file to forward all the Magento logs in the folder var/log/*.log to our ELK Stack:
...
filebeat.inputs:
- type: log
  enabled: true
  paths:
    - /www/var/log/*.log
  exclude_files: [ '\.gz$' ]
  tags: [ "magento-log" ]
  multiline.type: pattern
  multiline.pattern: '^[0-9]{4}-[0-9]{2}-[0-9]{2}'
  multiline.negate: true
  multiline.match: after
...
After the change we have to restart the Filebeat daemon on the Magento instance.
Configuring Logstash
The next important configuration now is the Logstash component. In order to be able for Logstash to process the application logs from Magento we have to add the following configuration in /etc/logstash/conf.d/02-beats-input.conf on the ELK server:
...
filter {
  if "magento-log" in [tags] {
    grok {
        match => { "message" => "%{TIMESTAMP_ISO8601:timestamp} %{DATA:level} \([0-9]+\): %{GREEDYDATA:message}"}
        overwrite => [ "message" ]
    }

    date {
        match => [ "timestamp", "ISO8601" ]
        remove_field => [ "timestamp" ]
    }
  }
}
...
Note: we use tags given by Filebeat to distinguish between different types of logs here.
Again after modifying the Logstash configuration we have to restart the Logstash service on the ELK Stack.
The Result
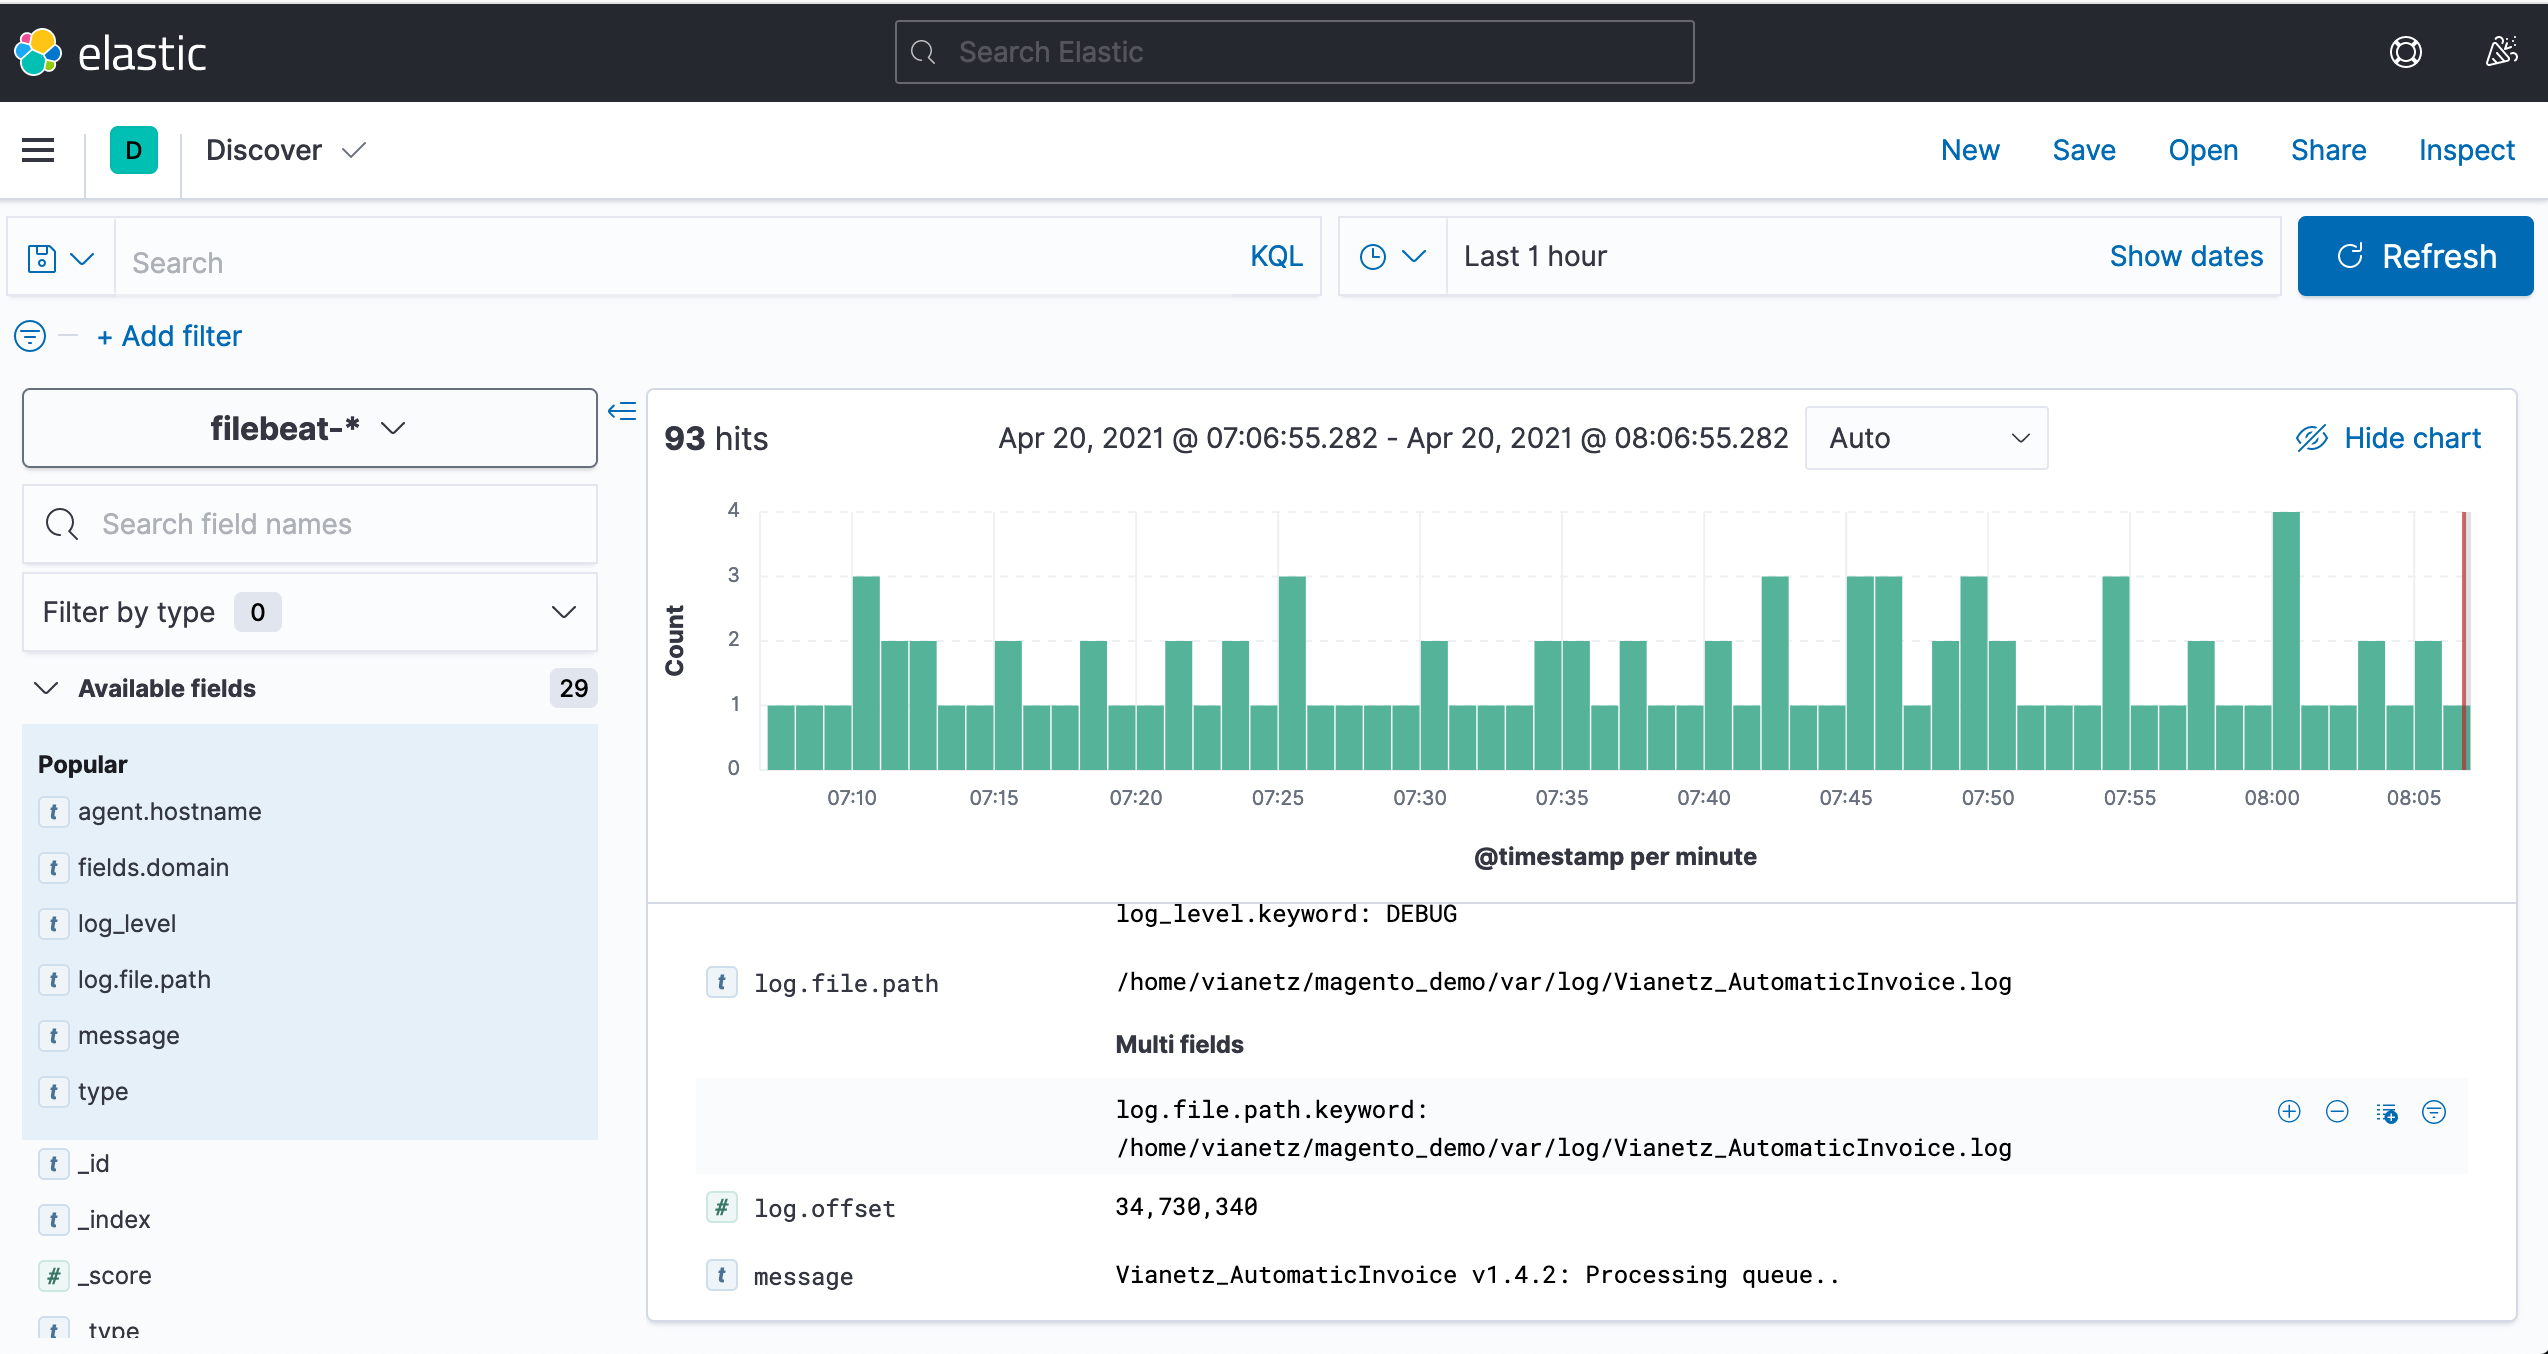
Then after a few minutes, log messages should start to roll into Kibana:
In one of the next blog posts we will examine more in detail cool things that you can do in the ELK Stack with your Magento 1 logs now. These are features like alerting, custom dashboards, joining data of different types, uptime monitoring and much more.

Post Comments to "Magento Logging with ELK Stack"